✓ 24/7 automatic processing of online orders
✓ Knowledgeable and professional Product & Technical Support
✓ Fast and reliable (re)-ordering
QIAseq miRNA Library QC Spike-ins
Cat. No. / ID: 331535
✓ 24/7 automatic processing of online orders
✓ Knowledgeable and professional Product & Technical Support
✓ Fast and reliable (re)-ordering
Features
- Unique qPCR-based sample QC of miRNA/small RNA samples prior to NGS
- Essential for challenging samples with low RNA content, such as biofluids
- LNA miRNA PCR Assays in ready-to-use PCR panels
- Compatible with all major qPCR instruments
- Comprehensive set of 52 RNA spike-ins, spanning a wide range of concentrations
- Thorough post-sequencing assessment of NGS linearity and reproducibility
Product Details
QIAseq miRNA Library QC PCR Assays and Arrays enable rigorous quality control of both sample quality before NGS library preparation as well as NGS performance post-sequencing. Amplification of the QIAseq miRNA Library QC Spike-ins – a comprehensive set of spike-ins added during RNA isolation or to isolated RNA – allows assessment of the reproducibility and linearity of the NGS reads mapped to these exogenous sequences, ensuring optimal miRNA sequencing results.
QIAseq miRNA Library Kits are recommended for gel-free library construction miRNA, piRNA and small RNA on Illumina and Thermo Fisher Scientific NGS instruments.
Principle
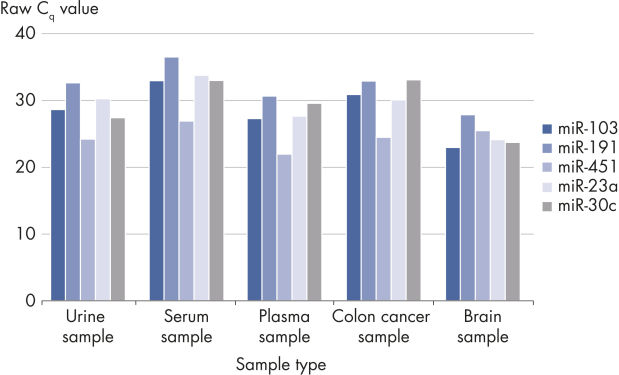
The kit is compatible with many samples types but is especially useful for challenging samples with low RNA content such as serum, plasma, urine and other biofluids.
| QIAseq miRNA Library QC PCR Panel Kit | QIAseq miRNA Library QC Spike-Ins | |
|---|---|---|
| Compatible with biofluid samples | ✓ | ✓ |
| Compatible with cells/tissue | — | ✓ |
| Evaluate RNA yield | ✓ | — |
| Evaluate miRNA/small RNA quality | ✓ | — |
| Evaluate library quality | ✓ | ✓ |
| Evaluate NGS reproducibility | ✓ | ✓ |
| Evaluate technical outliers | ✓ | ✓ |
Procedure
Addition of QIAseq miRNA Library QC Spike-Ins during RNA isolation enables monitoring of the comparability and reproducibility of the whole process from RNA isolation to NGS data analysis.
QIAseq miRNA Library QC Spike-Ins can also be added directly to RNA samples before small RNA library preparation. For more accurate ratios of spike-ins vs. endogenous miRNAs in other sample types or when using isolated RNA samples, experimental titration of QIAseq miRNA Library QC Spike-Ins is recommended.
The protocol consists of 5 steps:
1. Addition of 52 QIAseq miRNA Library QC Spike-Ins to the samples during RNA isolation
2. cDNA synthesis, including UniSp6 Spike-In
3. qPCR reactions
4. Sample evaluation and NGS of accepted samples
5. Evaluation of the QIAseq miRNA Library QC Spike-Ins data
Analysis and interpretation of data
The QIAseq miRNA Library QC Spike-In controls enable you to monitor the technical quality of the RNA isolation and cDNA synthesis and the presence of PCR inhibitors in the sample.
NGS interpretation:
The GeneGlobe data analysis center for QIAseq miRNA library kits will automatically align and report on the QIAseq miRNA spike-ins in addition to the aligned small/miRNA/piRNA from your sample.
qPCR Panel and Assay interpretation:
- Identification of outlier samples: Calculate delta CT for UniSp100 and UniSp101. The typical CT value for UniSp100 is in the 31–34 range and for UniSp101 in the 25–28 range. The delta CT for the two spike-ins should be around 5–7. When comparing different samples, there should be less than CT difference between any assay across samples.
- cDNA synthesis evaluation: Evaluate the UniSp6 across all samples. The value should be <2 CTs between any two samples.
- Evaluation of hemolysis (for serum/plasma biomarker identification): Delta CT (miR-23a – miR-451a) should be less than 5 for high-quality samples. A value of 5–7 should be considered a borderline sample. Samples with a value >7 should not be used.
NGS analysis:
- If you are using the QIAseq miRNA Library Kit, proceed to the GeneGlobe Data Analysis Center and configure the analysis site for Primary QIAseq miRNA Library Kit analysis. Simply upload your FASTQ file and configure “QIAseq Spike-in Added” to Yes.
- If using your own NGS data analysis pipeline, reads should be mapped to the QIAseq NGS Spike-in sequences (using Bowtie2 or similar mapping algorithm), and spike-in reads should be filtered out from the rest of the data. We recommend “perfect match” settings when mapping, filtering and counting QIAaseq NGS Spike-in reads in a dataset (FASTQ files). Following counting of the QIAseq NGS Spike-in reads, they should be normalized to the total number of reads per sample.
- After this simple normalization to individual sample reads has been done for all spike-ins in all samples, correlation matrices should be plotted for all sample-to-sample comparisons. This is done to evaluate the sample-to-sample correlation in the sample set. Expected correlation should be R2 of 0.95–0.99. If comparing day-to-day correlation, the correlation is usually weaker than within a batch of samples purified on the same day. If samples deviate from these values, they could be technical outliers and should potentially be excluded from downstream analysis.
Supporting data and figures
Useful for a wide range of sample types.


